In this recent post, we have explained how to use Kernel SHAP for interpreting complex linear models. As plotting backend, we used our fresh CRAN package “shapviz“.
“shapviz” has direct connectors to a couple of packages such as XGBoost, LightGBM, H2O, kernelshap, and more. Multiple times people asked me how to combine shapviz when the XGBoost model was fitted with Tidymodels. The workflow was not 100% clear to me as well, but the answer is actually very simple, thanks to Julia’s post where the plots were made with SHAPforxgboost, another cool package for visualization of SHAP values.
Example with shiny diamonds
Step 1: Preprocessing
We first write the data preprocessing recipe and apply it to the data rows that we want to explain. In our case, its 1000 randomly sampled diamonds.
library(tidyverse)
library(tidymodels)
library(shapviz)

# Integer encode factors
dia_recipe <- diamonds %>%
  recipe(price ~ carat + cut + clarity + color) %>%
  step_integer(all_nominal())

# Will explain THIS dataset later
set.seed(2)
dia_small <- diamonds[sample(nrow(diamonds), 1000), ]
dia_small_prep <- bake(
  prep(dia_recipe),
  has_role("predictor"),
  new_data = dia_small,
  composition = "matrix"
)
head(dia_small_prep)

#     carat cut clarity color
#[1,]  0.57   5       4     4
#[2,]  1.01   5       2     1
#[3,]  0.45   1       4     3
#[4,]  1.04   4       6     5
#[5,]  0.90   3       6     4
#[6,]  1.20   3       4     6
Step 2: Fit Model
The next step is to tune and build the model. For simplicity, we skipped the tuning part. Bad, bad 🙂
# Just for illustration - in practice needs tuning!
xgboost_model <- boost_tree(
  mode = "regression",
  trees = 200,
  tree_depth = 5,
  learn_rate = 0.05,
  engine = "xgboost"
)

dia_wf <- workflow() %>%
  add_recipe(dia_recipe) %>%
  add_model(xgboost_model)

fit <- dia_wf %>%
  fit(diamonds)
Step 3: SHAP Analysis
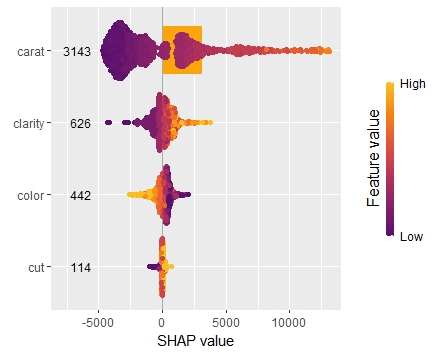
We now need to call shapviz() on the fitted model. In order to have neat interpretations with the original factor labels, we not only pass the prediction data prepared in Step 1 via bake(), but also the original data structure.
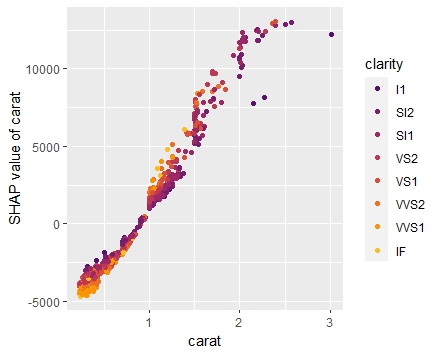
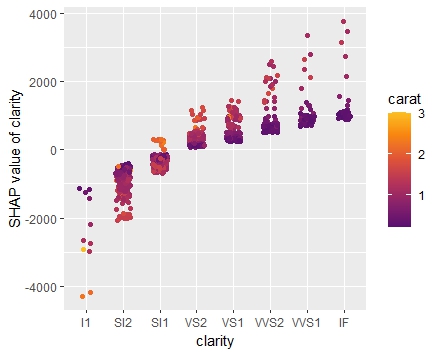
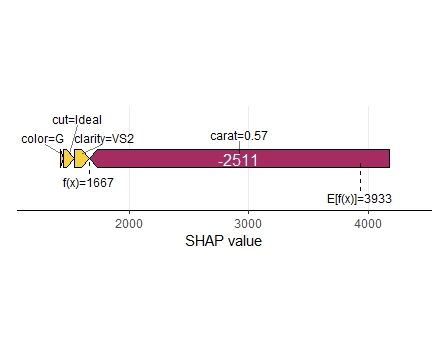
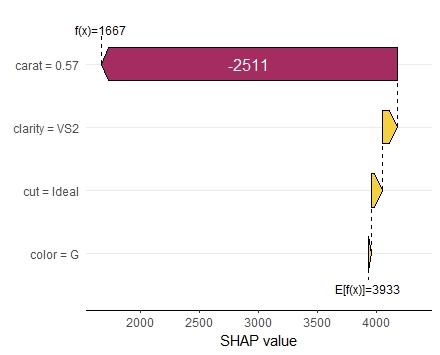
shap <- shapviz(extract_fit_engine(fit), X_pred = dia_small_prep, X = dia_small)

sv_importance(shap, kind = "both", show_numbers = TRUE)
sv_dependence(shap, "carat", color_var = "auto")
sv_dependence(shap, "clarity", color_var = "auto")
sv_force(shap, row_id = 1)
sv_waterfall(shap, row_id = 1)
Summary
Making SHAP analyses with XGBoost Tidymodels is super easy.
The complete R script can be found here.
Leave a Reply