One of the reasons why we love the “dplyr” package: it plays so well together with the forward pipe operator `%>%` from the “magrittr” package. Actually, it is not a coincidence that both packages were released quite at the same time, in 2014.
What does the pipe do? It puts the object on its left as the first argument into the function on its right: iris %>% head() is a funny way of writing head(iris). It helps to avoid long function chains like f(g(h(x))), or repeated assignments.
In 2021 and version 4.1, R has received its native forward pipe operator |> so that we can write nice code like this:
Since version 4.2, the piped object can be referenced by the underscore _, but just once for now, see an example below.
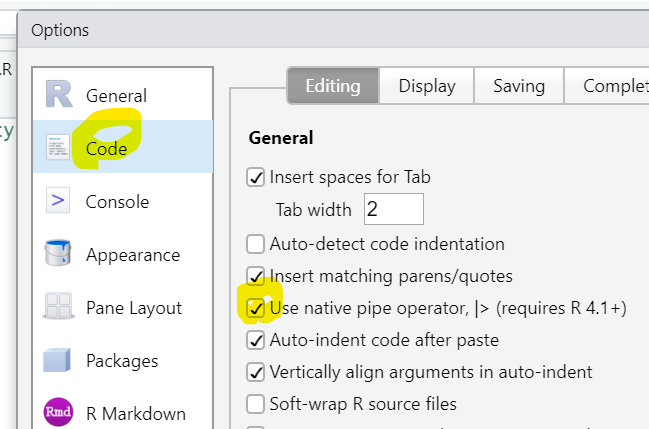
To use the native pipe via CTRL-SHIFT-M in Posit/RStudio, tick this:
Combined with the many great functions from the standard distribution of R, we can get a real “dplyr” feeling without even loading dplyr. Don’t get me wrong: I am a huge fan of the whole Tidyverse! But it is a great way to learn “Standard R”.
Data chains
Here a small selection of standard functions playing well together with the pipe: They take a data frame and return a modified data frame:
subset(): Select rows and columns of data frametransform(): Add or overwrite columns in data frameaggregate(): Grouped calculationsrbind(),cbind(): Bind rows/columns of data frame/matrixmerge(): Join data frames by keyhead(),tail(): First/last few elements of objectreshape(): Transposition/Reshaping of data frame (no, I don’t understand the interface)
library(ggplot2)  # Need diamonds

# What does the native pipe do?
quote(diamonds |> head())

# OUTPUT
# head(diamonds)

# Grouped statistics
diamonds |>
  aggregate(cbind(price, carat) ~ color, FUN = mean)

# OUTPUT
#   color    price     carat
# 1     D 3169.954 0.6577948
# 2     E 3076.752 0.6578667
# 3     F 3724.886 0.7365385
# 4     G 3999.136 0.7711902
# 5     H 4486.669 0.9117991
# 6     I 5091.875 1.0269273
# 7     J 5323.818 1.1621368

# Join back grouped stats to relevant columns
diamonds |>
  subset(select = c(price, color, carat)) |>
  transform(price_per_color = ave(price, color)) |>
  head()

# OUTPUT
#   price color carat price_per_color
# 1   326     E  0.23        3076.752
# 2   326     E  0.21        3076.752
# 3   327     E  0.23        3076.752
# 4   334     I  0.29        5091.875
# 5   335     J  0.31        5323.818
# 6   336     J  0.24        5323.818

# Plot transformed values
diamonds |>
  transform(
    log_price = log(price),
    log_carat = log(carat)
  ) |>
  plot(log_price ~ log_carat, col = "chartreuse4", pch = ".", data = _)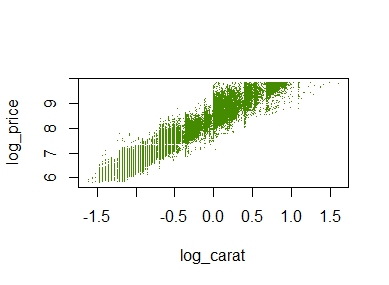
The plot does not look quite as sexy as “ggplot2”, but its a start.
Other chains
The pipe not only works perfectly with functions that modify a data frame. It also shines with many other functions often applied in a nested way. Here two examples:
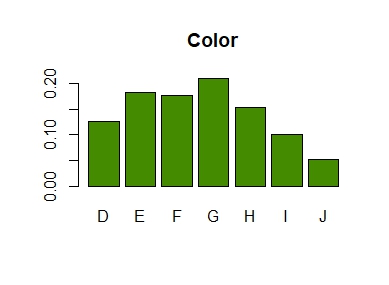
# Distribution of color within clarity
diamonds |>
  subset(select = c(color, clarity)) |>
  table() |>
  prop.table(margin = 2) |>
  addmargins(margin = 1) |>
  round(3)

# OUTPUT
# clarity
# color      I1   SI2   SI1   VS2   VS1  VVS2  VVS1    IF
#     D   0.057 0.149 0.159 0.138 0.086 0.109 0.069 0.041
#     E   0.138 0.186 0.186 0.202 0.157 0.196 0.179 0.088
#     F   0.193 0.175 0.163 0.180 0.167 0.192 0.201 0.215
#     G   0.202 0.168 0.151 0.191 0.263 0.285 0.273 0.380
#     H   0.219 0.170 0.174 0.134 0.143 0.120 0.160 0.167
#     I   0.124 0.099 0.109 0.095 0.118 0.072 0.097 0.080
#     J   0.067 0.052 0.057 0.060 0.066 0.026 0.020 0.028
#     Sum 1.000 1.000 1.000 1.000 1.000 1.000 1.000 1.000

# Barplot from discrete column
diamonds$color |>
  table() |>
  prop.table() |>
  barplot(col = "chartreuse4", main = "Color")
Wrap up
- Piping is fun with and without dplyr.
- It is a great motivation to learn standard R
The complete R script can be found here.
Leave a Reply