With its newest release 1.1.0, the Python package model-diagnostics got the concept of a plotting backend. Before this release, all plots were constructed with matplotlib. This is still the default. But additionally, the user can now select plotly, if it is installed.
There are 2 ways to specify the plotting backend explicitly
Setting the plotting backend via global configuation
from model_diagnostics import set_config

set_config(plot_backend="plotly")
Setting the plotting backend via a context manager
from model_diagnostics import config_context
from model_diagnostics.calibration import plot_bias

with config_context(plot_backend="plotly"):
    plot_bias(...)
The context manager has precedence over the global setting. Here is an example of an interactive reliability diagram backed by plotly:
import numpy as np
from model_diagnostics.calibration import plot_reliability_diagram
from model_diagnostics import set_config

set_config(plot_backend="plotly")

x = np.linspace(0, 2 * np.pi, 100)
y_obs = np.cos(x)
# A poor linear interpolation through extrema as predictions.
y_pred = np.interp(x, [0, np.pi, 2 * np.pi], [1, -1, 1])
ax = plot_reliability_diagram(y_obs=y_obs, y_pred=y_pred)
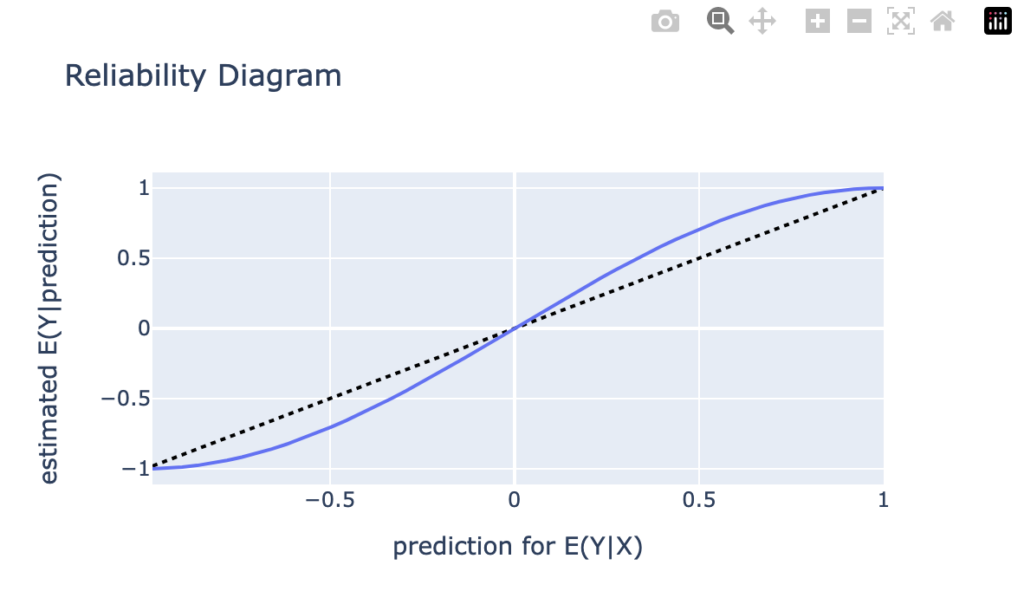
If you wonder why this graph is not interactive despite promised to be, here is why: While this graph renders nicely in a juper lab notebook, for instance, this website is built with wordpress and I was simply unable to figure out a way to get the html of the graph rendered properly—without wordpress crashing. I you know a way, please contact me.
Code above as notebook: https://github.com/lorentzenchr/notebooks/blob/master/blogposts/2024-04-15%20reliability_plot_plotly.ipynb
Leave a Reply