Lost in Translation between R and Python 2
Hello again!
This is the next article in our series “Lost in Translation between R and Python”. The aim of this series is to provide high-quality R and Python 3 code to achieve some non-trivial tasks. If you are to learn R, check out the R tab below. Similarly, if you are to learn Python, the Python tab will be your friend.
Post 1: https://lorentzen.ch/index.php/2021/01/07/illustrating-the-central-limit-theorem/
In Post 2, we use a publicly available data of the European Centre for Disease Prevention and Control to calculate Covid-19 deaths per Mio persons over time and across countries . We will use slim Python and R codes to
- fetch the data directly from the internet,
- prepare and restructure it for plotting and
- plot a curve per selected country.
Note that different countries use different definitions of whom to count as Covid-19 death and these definitions might also have changed over time. So be careful with comparisons!
library(tidyverse)

# Source and countries
link <- "https://opendata.ecdc.europa.eu/covid19/casedistribution/csv"
countries <- c("Switzerland", "United_States_of_America",
               "Germany", "Sweden")

# Import
df0 <- read_csv(link)

# Data prep
df <- df0 %>%
  mutate(Date = lubridate::dmy(dateRep),
         Deaths = deaths_weekly / (popData2019 / 1e6))  %>%
  rename(Country = countriesAndTerritories) %>%
  filter(Date >= "2020-03-01",
         Country %in% countries)

# Plot
ggplot(df, aes(x = Date, y = Deaths, color = Country)) +
  geom_line(size = 1) +
  ylab("Weekly deaths per Mio") +
  theme(legend.position = c(0.2, 0.85))
import pandas as pd
# Source and countries
url = "https://opendata.ecdc.europa.eu/covid19/casedistribution/csv"
countries = ["Switzerland", "United_States_of_America",
"Germany", "Sweden"]
# Fetch data
df0 = pd.read_csv(url)
# df0.head()
# Prepare data
df = df0.assign(
Date=lambda x: pd.to_datetime(x["dateRep"], format="%d/%m/%Y"),
Deaths=lambda x: x["deaths_weekly"] / x["popData2019"] * 1e6,
).rename(columns={"countriesAndTerritories": "Country"})
df = df.loc[
(df["Country"].isin(countries)) & (df["Date"] >= "2020-03-01"),
["Country", "Date", "Deaths"],
]
df = df.pivot(index="Date", columns="Country")
df = df.droplevel(0, axis=1)
# Plot
ax = df.plot()
ax.set_ylabel('Weekly Covid-19 deaths per Mio');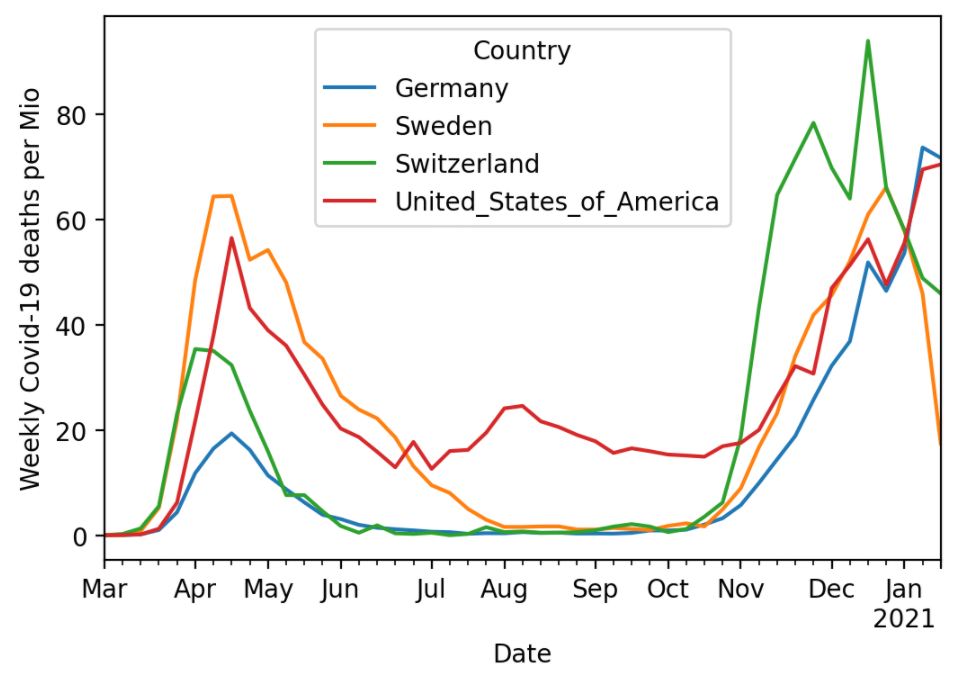
The code can be found on https://github.com/mayer79/covid with some other analyses regarding viruses.
For more feed, visit
Leave a Reply