
LightSHAP is here – a new, lightweight SHAP implementation for tabular data. While heavily inspired from the famous shap package, it has no dependency on it. LightSHAP simplifies working with dataframes (pandas, polars) and categorical data.
Key Features
- Tree Models: TreeSHAP wrappers for XGBoost, LightGBM, and CatBoost via
explain_tree() - Model-Agnostic: Permutation SHAP and Kernel SHAP via
explain_any() - Visualization: Flexible plots
Highlights of the agnostic explainer:
- Exact and sampling versions of permutation SHAP and Kernel SHAP
- Sampling versions iterate until convergence, and provide standard errors
- Parallel processing via joblib
- Supports multi-output models
- Supports case weights
- Accepts numpy, pandas, and polars input, and categorical features
Some methods of the explanation object:
plot.bar(): Feature importance bar plotplot.beeswarm(): Summary beeswarm plotplot.scatter(): Dependence plotsplot.waterfall(): Waterfall plot for individual explanationsimportance(): Returns feature importance valuesset_X(): Update explanation data, e.g., to replace a numpy array with a DataFrameset_feature_names(): Set or update feature namesselect_output(): Select a specific output for multi-output modelsfilter(): Subset explanations by condition or indices- …
Usage
Let’s demonstrate the two workhorses explain_tree() and explain_any() with small examples.
Prepare diamonds data
import catboost
import numpy as np
import seaborn as sns
import statsmodels.formula.api as smf

# pip install lightshap
from lightshap import explain_any, explain_tree

# Prepare data
df0 = sns.load_dataset("diamonds")

df = df0.assign(
    log_carat=lambda x: np.log(x.carat),
    log_price=lambda x: np.log(x.price),
)

# Features only
X = df[["log_carat", "clarity", "color", "cut"]]
Fit and explain boosted trees model
Let’s (naively) build a small CatBoost model and explain ot using a sample of 1000 observations.
# Fit naively without validation strategy for simplicity
gbt = catboost.CatBoostRegressor(
iterations=100, depth=4, cat_features=["clarity", "color", "cut"], verbose=0
)
_ = gbt.fit(X, y=df.log_price)
# SHAP analysis
X_explain = X.sample(1000, random_state=0)
gbt_explanation = explain_tree(gbt, X_explain)
gbt_explanation.plot.bar()
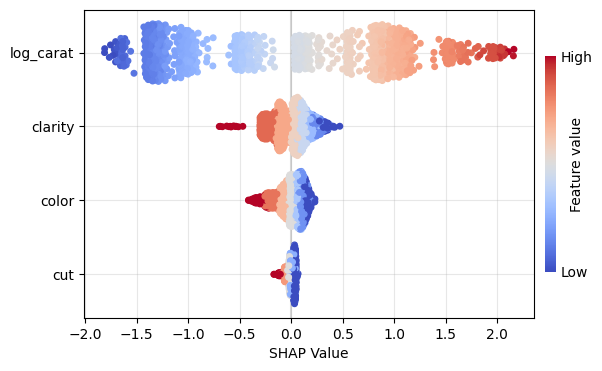
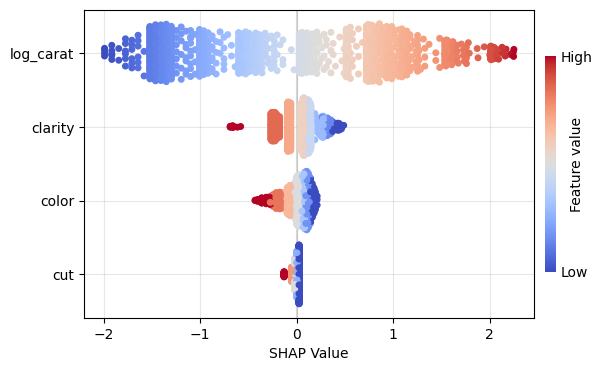
gbt_explanation.plot.beeswarm()
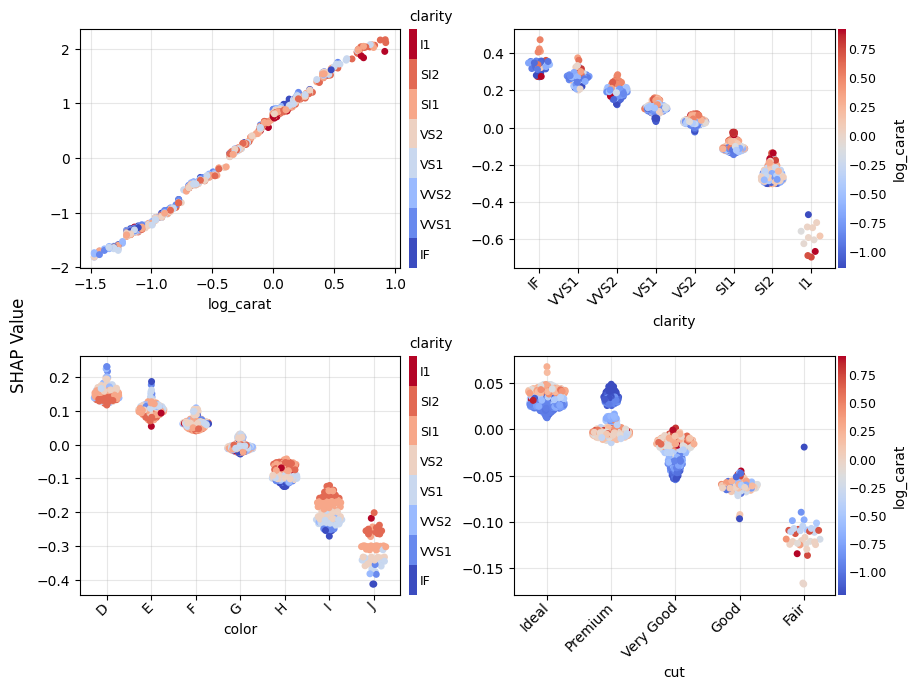
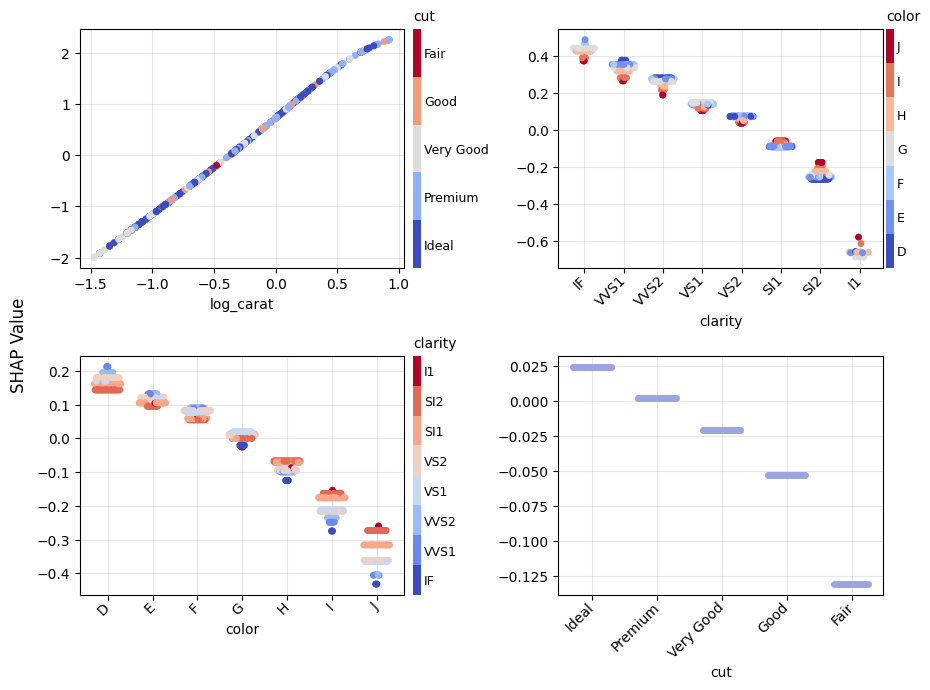
gbt_explanation.plot.scatter(sharey=False)
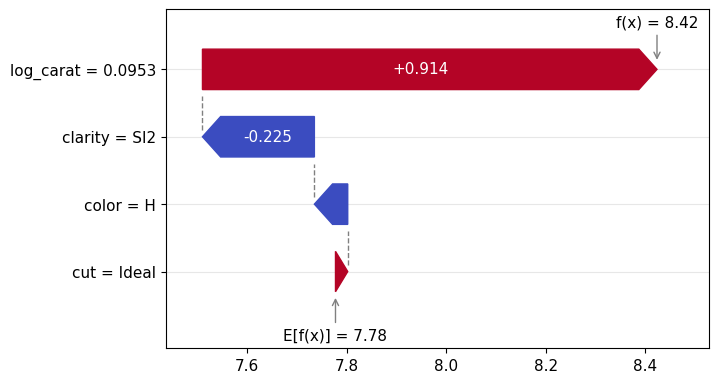
gbt_explanation.plot.waterfall(row_id=0)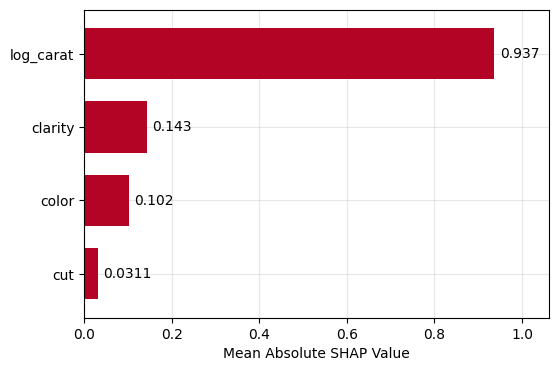

Fit and explain any model
To demonstate the model agnostic SHAP cruncher explain_any(), let’s fit a linear regression model with interactions and natural cubic spline.
lm = smf.ols("log_price ~ cr(log_carat, df=4) + clarity * color + cut", data=df)
lm = lm.fit()

# SHAP analysis - automatically picking exact permutation SHAP
# due to the small number of features
X_explain = X.sample(1000, random_state=0)
lm_explanation = explain_any(lm.predict, X_explain)  # 5s on laptop

lm_explanation.plot.bar()
lm_explanation.plot.beeswarm()
lm_explanation.plot.scatter(sharey=False)
lm_explanation.plot.waterfall(row_id=0)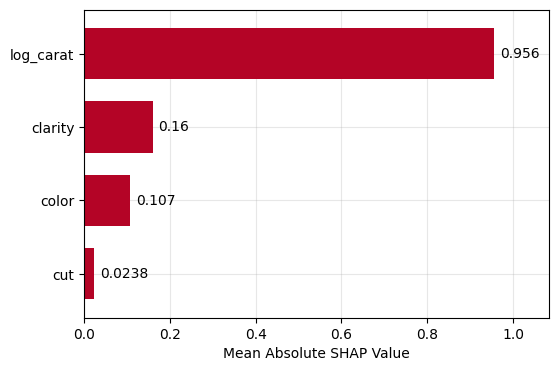
How to contribute?
- Test, test, test: The more people are using and testing the current beta version of the package, the better it will get.
- Open issues: If you see problems or gaps, please open an issue. Then we will discuss if/who will work on this.
Future plans
In its current early stage, the project is still a “one-man show”. While growing, the aim is to move the project to a bigger organisation, e.g., a university.
Leave a Reply